A simulation is a computer reconstruction of the debris flow: the model receives the terrain, buildings, rainfall, and a hypothesis about where the mud emerged, and calculates where it flows and to what depth. This page explains the most important simulations in plain language. Full details are in the paper(Spanish original) (appendix), and the table of all simulations is in Data.
≈80simulations: 19 screening runs with the previous terrain, 37 with the full city, 5 for concentration quadrature, and 19 campus microsimulations
79–82/100index of the integrated hypothesis depending on rainfall: 82 with an assumed 35 mm/h (verified with a fine time step), 81 with rainfall measured at Río Molina, and 79 with that rainfall spread over 4 h; 72 for the hypothesis used in the held-out test. This is a fit, not an accuracy measure
~65 m³/scalculated discharge at the culvert inlet; the capacities tested (10–200 m³/s) are hypothetical scenarios
~300 thousand m³calculated volume, not measured
How to read the figures
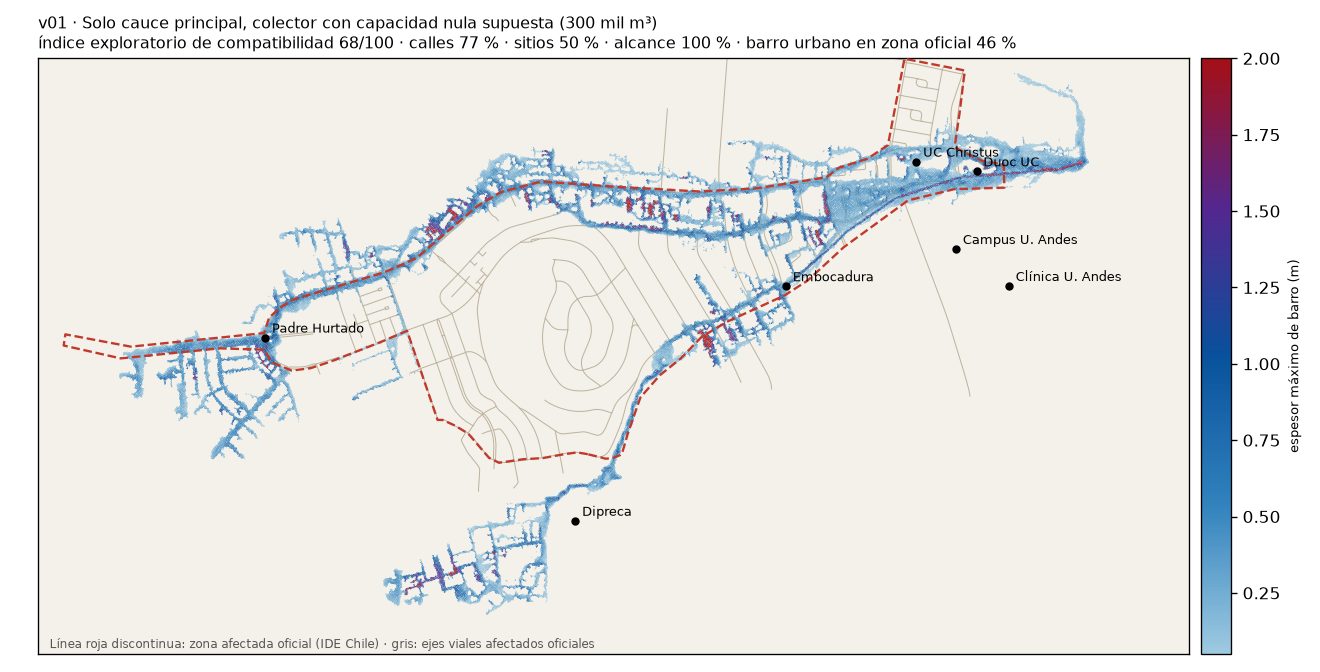
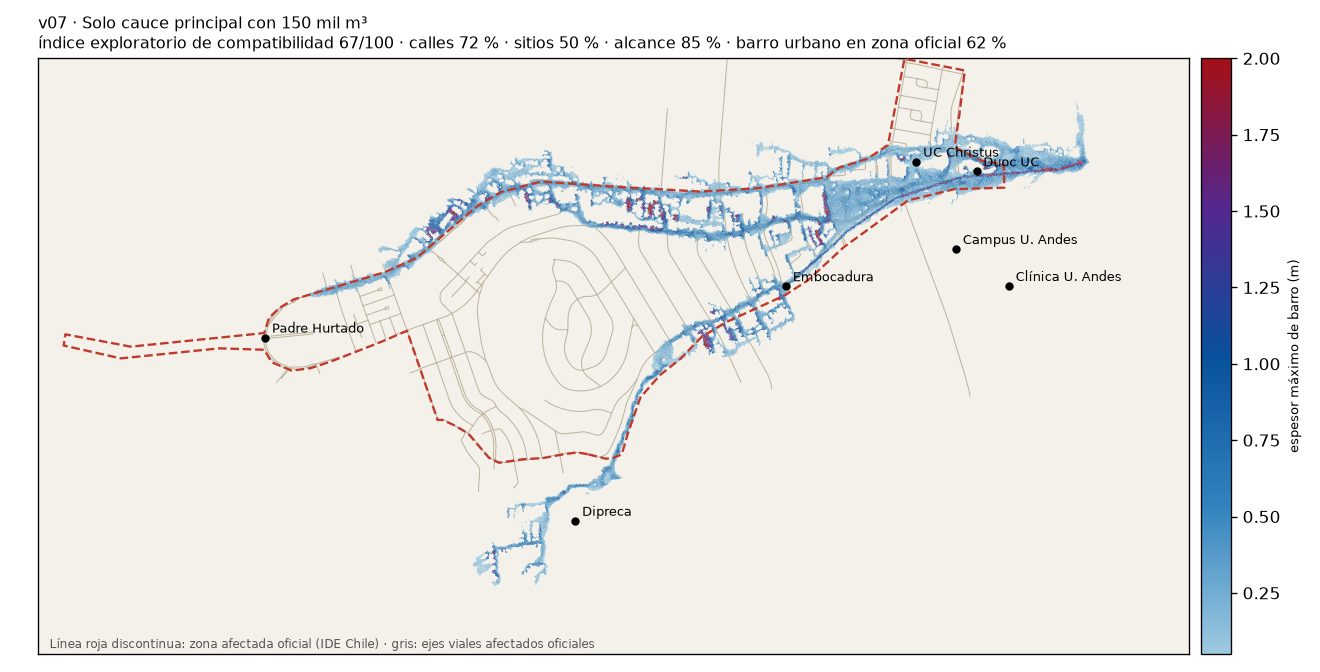
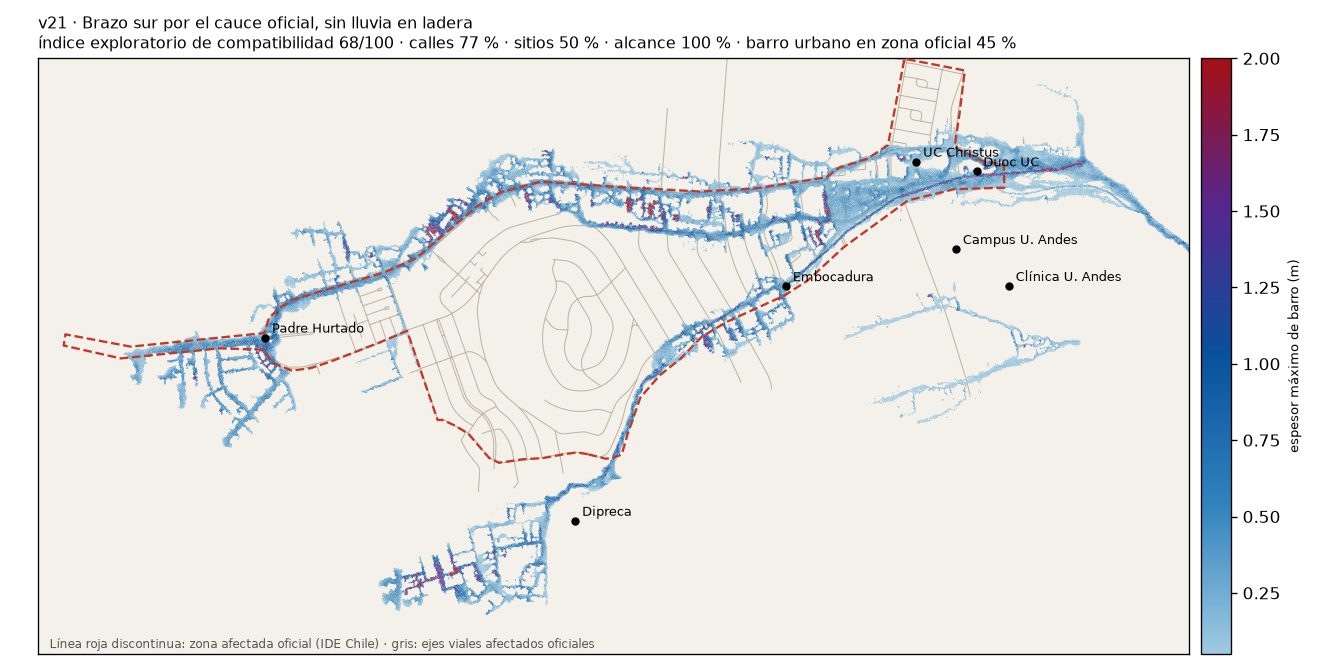
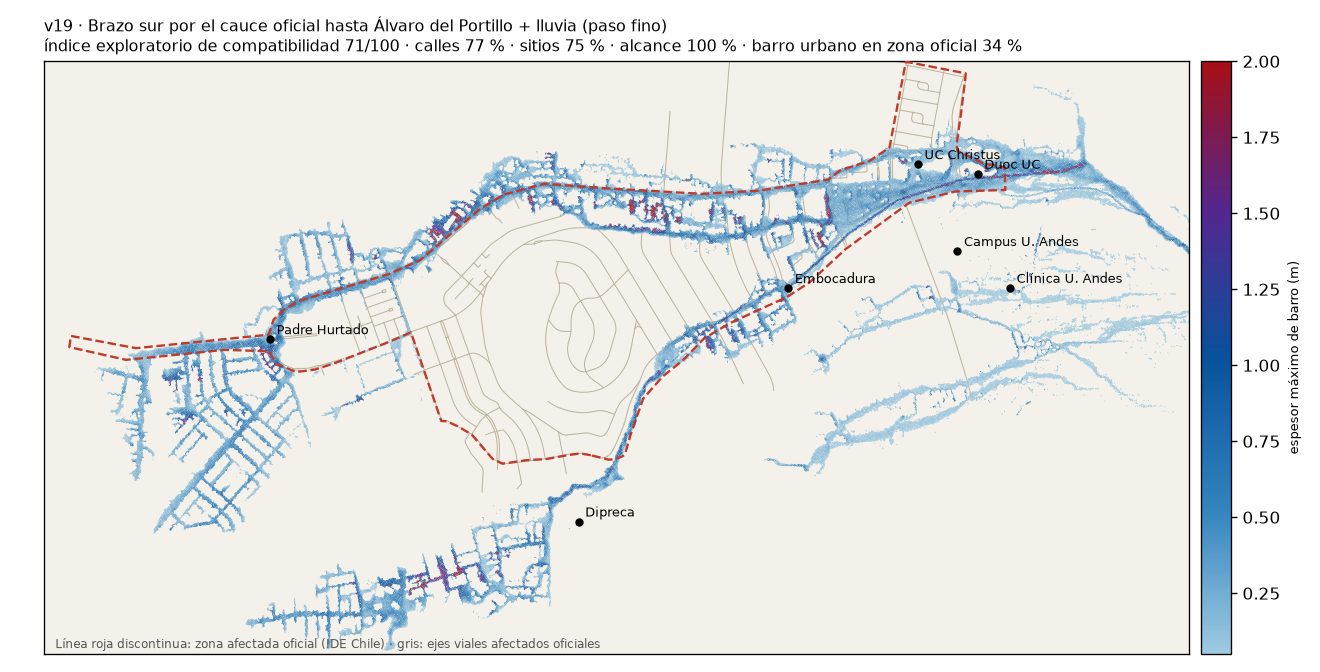
The map labels are in Spanish. Blue to purple shows the maximum simulated mud thickness. The dashed red line is the official affected area published by IDE Chile and Ministerio de Bienes Nacionales; the gray lines are the officially affected streets. The exploratory compatibility index (0–100), defined after the criteria, is the average of four components corresponding to criteria set before simulation: streets where mud was observed, affected facilities (UC Christus, Duoc UC, Clínica and campus of U. de los Andes), reach to Padre Hurtado, and how much of the simulated mud falls within the official area. It is neither a probability nor predictive accuracy: it serves to compare hypotheses, and differences of 2 or 3 points are not significant. If the facilities component depends only on the campus control point and that point is not wetted with a fine time step, it is calculated without it. The index rewards the fraction of mud within the official area, so it does not fall when there is less mud. The values in the figures are calculated by the model; culvert capacities are hypothetical scenarios. Observations for these four criteria were used to formulate and select hypotheses, so the index measures compatibility, not validation. The test using held-out observations, defined in advance, yielded an unfavorable result (see below).
Tests following the held-out test (fitting)
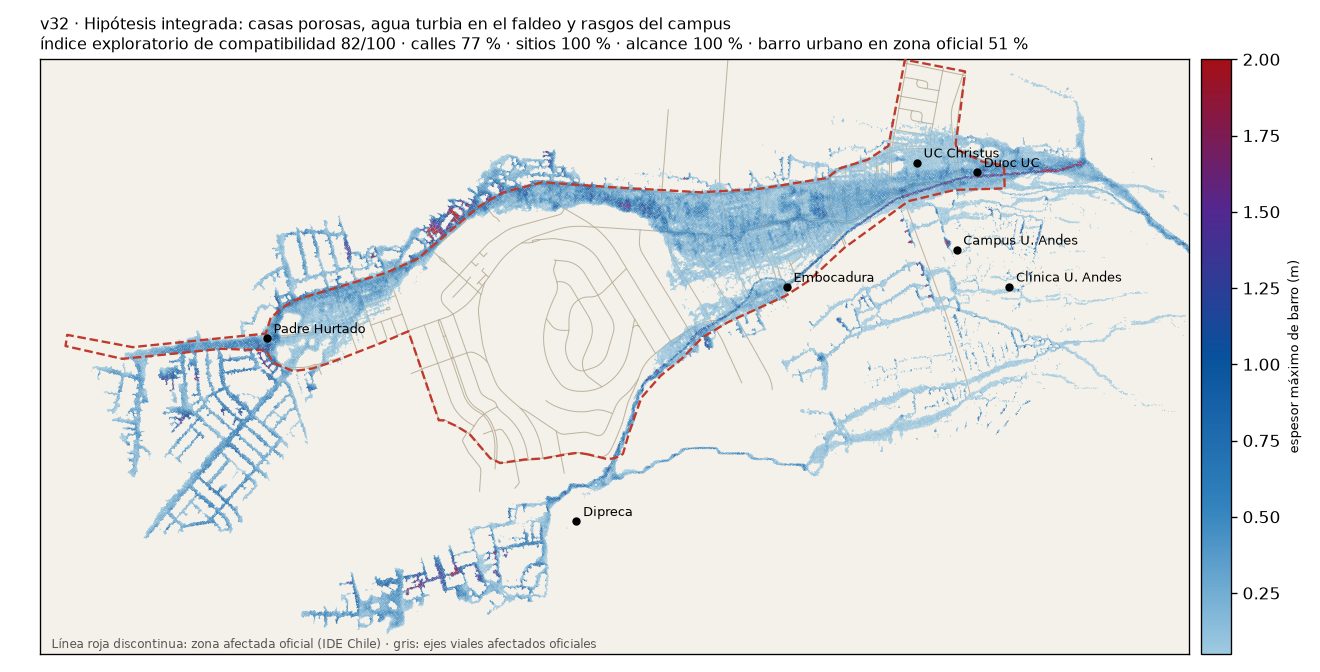
v32 · Integrated hypothesis: porous houses, turbid water on the lower hillside, and campus features
Index 82/100Streets 77Facilities 100Reach 100Mud in official area 51
What it tests
Combines what was learned after the held-out test: houses in the official area that allow mud to enter, turbid water (Cv 0.10) on the lower hillside of the campus and on La Plaza Sur, Cv 0.40 mud in the main branch, and features not resolved by the 30 m terrain (the hill road, the lower carriageway of La Plaza Sur, and entrances to the university and parking lot), with rainfall over the entire lower hillside outside the contributing catchments.
What it shows
Calculated: meets all four original criteria (ECI 82/100; the repeat with a fine time step, z32, gives the same value); the share of urban mud within the official area reaches 51 %; the campus registers 0.61 m; La Plaza Sur is wet along 46 % of its length; water enters the courtyard (0.07 m) and the parking lot through the clearing.
Where it falls short
It calculates 0.30 m in the UC Christus emergency department (reported: about 1 m). Less water reaches the campus than in the detailed simulations, because rainfall excludes the contributing catchments, which include part of the hill. It is conditioned on rainfall of 35 mm/h for one hour, greater than the measured rainfall: with measured rainfall it obtains 79/100 (spread evenly) or 81/100 (with its pulse shape).
What hypotheses it suggests
That thick mud in the main branch and turbid water on campus were distinct processes on the same day, and that retention within properties explains part of the distribution within the official area.
Status
ECI 82/100 verified with a fine time step (z32). Fitting after the held-out test.
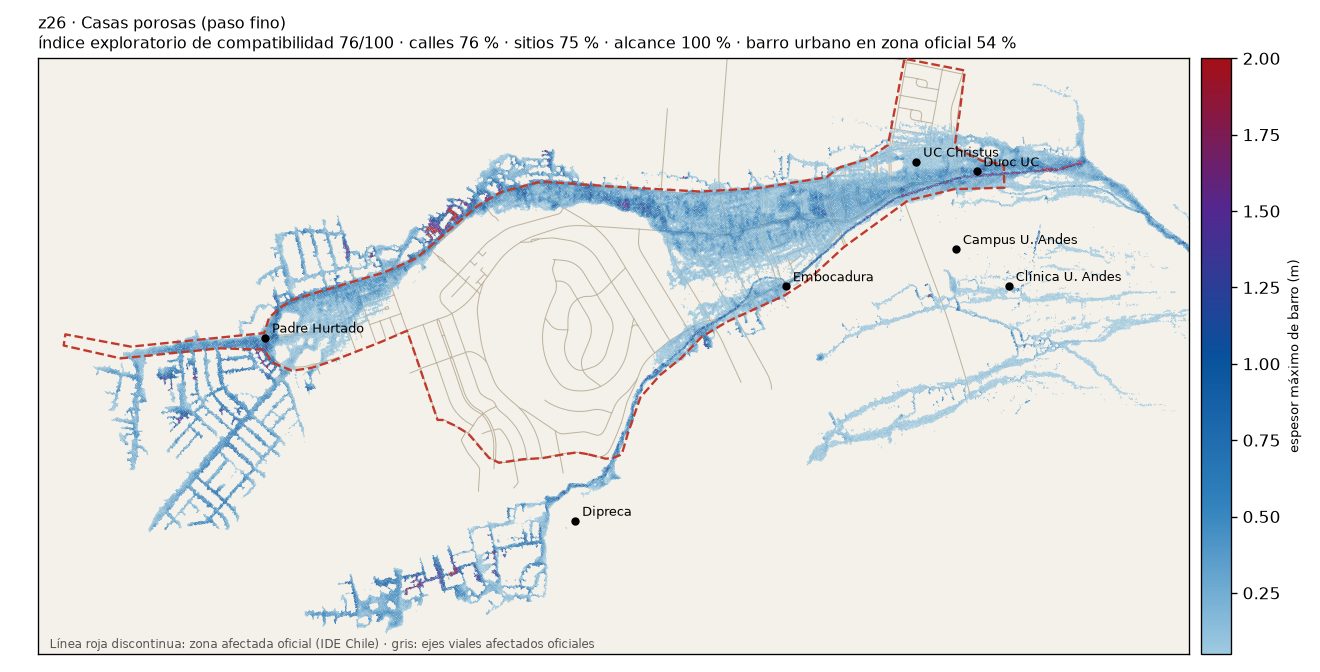
z26 · Porous houses (fine time step)
Index 76/100Streets 76Facilities 75Reach 100Mud in official area 54
What it tests
Allowing buildings in the official area to admit mud (floor at terrain elevation plus 0.3 m and high resistance), instead of representing them as solid blocks.
What it shows
Calculated: the share of urban mud within the official area rises from 34 % to 54 %; it wets 36 % of the official area and 40 % of its affected properties; it meets all four original criteria. Halving the resistance (v30) makes almost no difference.
Where it falls short
Thickness in the UC Christus emergency department falls to 0.30 m. The campus point remains dry with a fine time step.
What hypotheses it suggests
Mud retention within properties is key to the distribution within the official area; its exact representation remains an assumption.
Status
ECI verified with a fine time step: 76/100 (subsequent fitting).
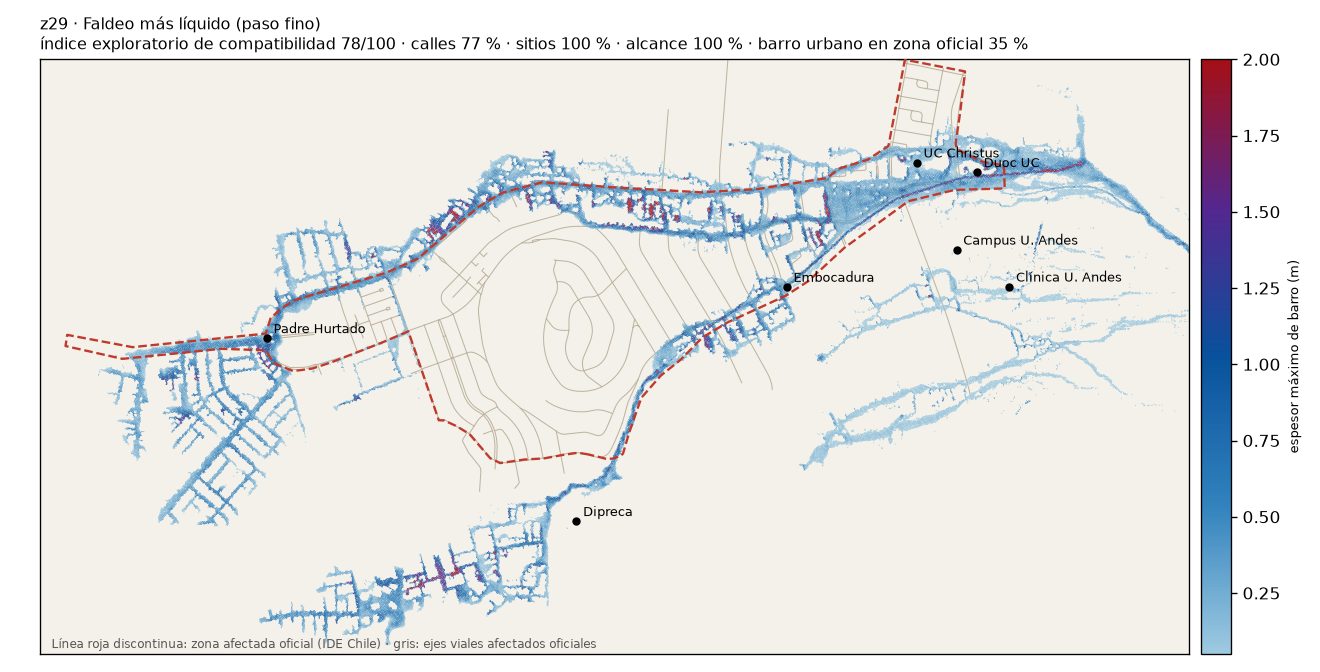
z29 · More liquid flow on the lower hillside (fine time step)
Index 78/100Streets 77Facilities 100Reach 100Mud in official area 35
What it tests
Two mud types depending on the area: Cv 0.27 on the lower hillside of the campus and Cv 0.43 in the main branch, with rainfall only outside the contributing catchments.
What it shows
Calculated: the campus control point remains wet with a fine time step (0.09 m), unlike the hypothesis with a single mud type (0.01 m).
Where it falls short
It does not reduce mud outside the official area: the fraction within it remains at 0.35.
What hypotheses it suggests
A more liquid fluid on the lower hillside, compatible with the turbid water in the video, consistently wets the campus.
Status
ECI verified with a fine time step: 78/100 (subsequent fitting).
Hypothesis selected for the held-out test
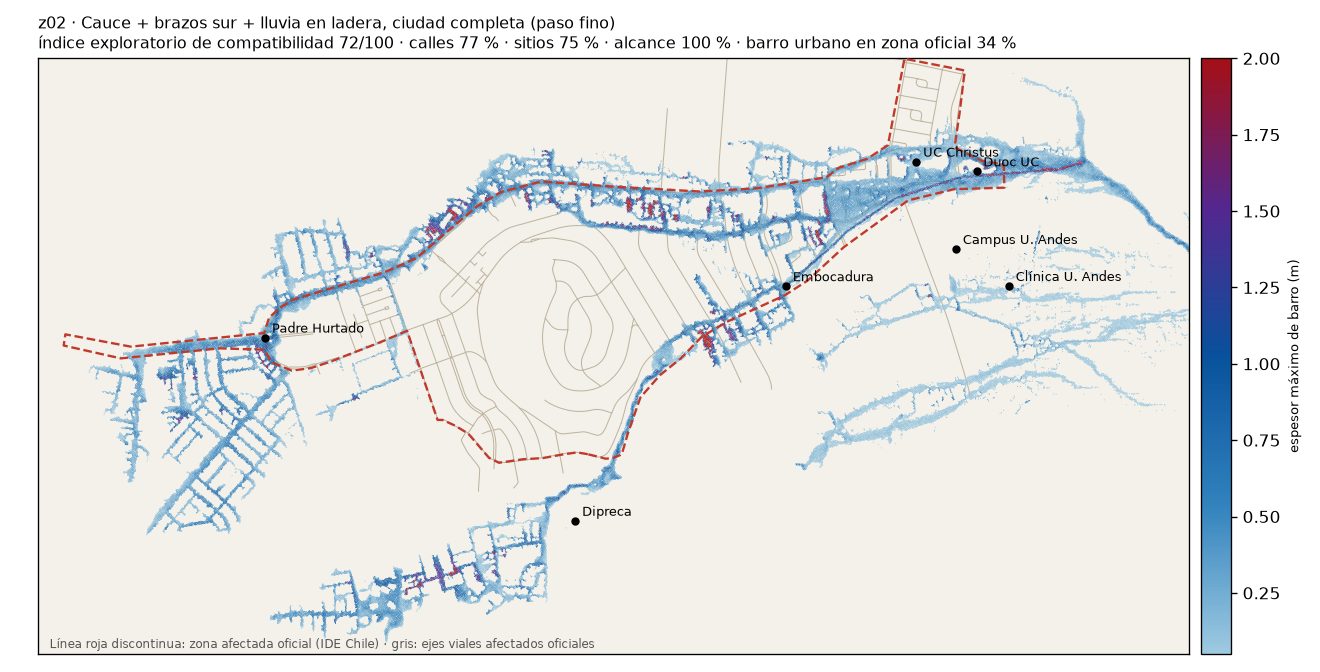
z02 · Channel + southern branches + hillside rainfall, full city (all 42,018 buildings; fine step)
Index 72/100Streets 77Facilities 75Reach 100Mud in official area 34
What it tests
The hypothesis selected before the test with held-out observations: mud emerges through the main channel onto the alluvial fan and through the southern branches, and rainfall of 35 mm/h is also applied to the burned hillside. It repeats v02 with a time step four times finer to examine sensitivity to time step.
What it shows
Calculated: the simulated flow follows the two corridors delimiting the official area (El Alba–General Blanche and Quebrada Honda) and reaches within 200 m of Padre Hurtado; near Clínica UC Christus it calculates 1.13 m (the source consulted reported about 1 m in the emergency department) and it produces flow beside Clínica U. de los Andes. The indicators match those of v02; this numerical check does not validate the event reconstruction.
Where it falls short
Only one third of the simulated mud in the urban area falls within the official area: it extends west of Padre Hurtado, along Quebrada Honda toward Dipreca and, because of the applied rainfall, along streets in other neighborhoods. It does not reach the U. de los Andes campus. Some applied rainfall (about 9,400 m³) overlaps with catchments already included through the hydrographs; v28 corrects this.
What hypotheses it suggests
In z02, the hillside rainfall contribution helps reproduce flow beside the clinic; its predominance during the event remains a hypothesis. Building representation, coarse material, and vegetation are considered possible explanations for the extent outside the official area (v25–v27).
Status
Hypothesis selected before the test using held-out observations (unfavorable test result): ECI 72/100. Subsequent tests (porous houses, liquid flow on the lower hillside, integrated hypothesis) exceed this score through fitting.
Full city (all 42,018 buildings)
v01 · Main channel only, culvert capacity assumed to be zero (300 thousand m³)
Index 68/100Streets 77Facilities 50Reach 100Mud in official area 46
What it tests
All mud emerges through the main channel onto the alluvial fan, with the General Blanche conduits and the Bulnes Correa culvert assumed to have zero capacity (hypothetical scenario).
What it shows
Calculated: with the 42 thousand buildings, flow is channeled along the streets; it calculates 1.16 m near UC Christus (0.3 m with the previous terrain), 1.9 m beside Duoc UC, reaches within 96 m of Padre Hurtado, and wets Quebrada Honda.
Where it falls short
It does not reproduce impacts beside Clínica U. de los Andes, on La Plaza Sur, or on the campus.
What hypotheses it suggests
This configuration does not reproduce impacts in the southern sector. Inflows from that sector are one of the hypotheses considered to explain the discrepancy.
Status
Reference: ECI 68/100.
v07 · Main channel only with 150 thousand m³
Index 67/100Streets 72Facilities 50Reach 85Mud in official area 62
What it tests
Same as v01, but with half the volume: the central value of the first rainfall-based estimate.
What it shows
Calculated: the front stops 348 m from Padre Hurtado.
Where it falls short
It does not meet the reach criterion.
What hypotheses it suggests
In the scenarios tested and under their assumptions, about 300 thousand m³ allows the reach criterion to be reproduced; that order of magnitude is consistent with a rainfall-based estimate adopting the soil saturation reported by the authority.
Status
The low-volume configuration does not meet the reach criterion: ECI 67/100.
U. Andes campus
v21 · Southern branch along the official channel, without hillside rainfall
Index 68/100Streets 77Facilities 50Reach 100Mud in official area 45
What it tests
The southern branch follows the route in the official hydrographic network to the upper part of Av. Álvaro del Portillo, where the official alignment ends and the model lets the flow emerge onto the avenue. Without hillside rainfall, to isolate its effect.
What it shows
Calculated: mud from the southern branch reaches the avenue (0.48 m where the channel ends) and flows down it toward La Plaza and General Blanche, in a manner compatible with reports by the university's vice-rector and Carabineros.
Where it falls short
Without hillside rainfall, impacts beside Clínica U. de los Andes are not reproduced (0 m) and flow does not reach the Biblioteca.
What hypotheses it suggests
In the configurations compared, hillside rainfall allows impacts beside the clinic to be reproduced, and the southern branch generates overflow compatible with that reported on the north side of the campus.
Status
ECI 68/100.
v19 · Southern branch along the official channel to Álvaro del Portillo + rainfall (fine step)
Index 71/100Streets 77Facilities 75Reach 100Mud in official area 34
What it tests
The selected hypothesis (z02) with the southern branch routed according to the official mapping, to examine whether the flow reaches the campus and Aula Magna.
What it shows
Calculated: it reproduces overflow in the upper part of Álvaro del Portillo and its descent along the avenue, in addition to what z02 achieves.
Where it falls short
The simulated flow follows the avenue, which is steeper (~8 %) than the woodland toward the Biblioteca (~4 %), and does not reach the depression beside the building or the campus control point (1 cm).
What hypotheses it suggests
Subsequent microsimulations showed that this overflow does not reach the campus courtyard with any fluid tested; the most compatible mechanism is turbid hillside runoff channeled by La Plaza Sur, entering through a clearing and requiring features unresolved by the 30 m terrain to be carved.
Status
ECI 71/100. Superseded: campus water is attributed to local runoff (see v32).
Bulnes Correa culvert (hypothetical scenarios)
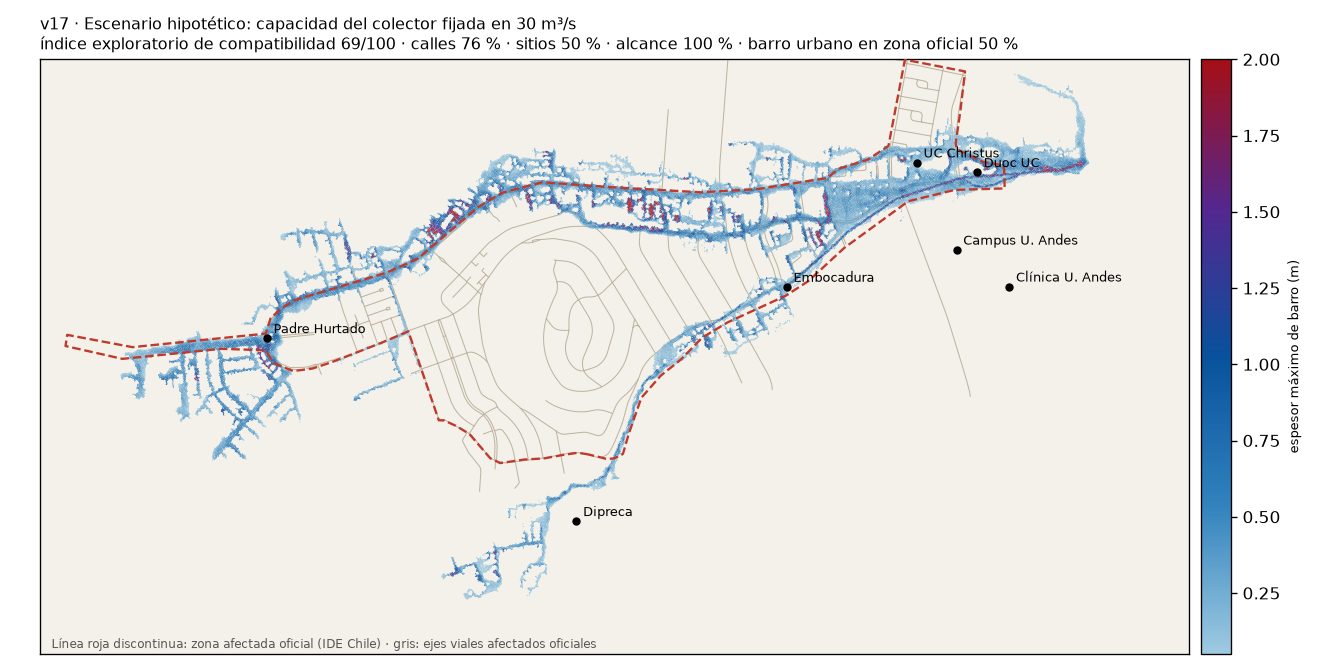
v17 · Hypothetical scenario: culvert capacity set at 30 m³/s
Index 69/100Streets 76Facilities 50Reach 100Mud in official area 50
What it tests
Hypothetical scenario with culvert capacity set at 30 m³/s and capture across the entire channel cross-section. The actual capacity and condition of the culvert are not public.
What it shows
Calculated: the modeled culvert reaches the imposed capacity (removes 67.6 thousand m³ at 30 m³/s), and Quebrada Honda is wetted at 62 % of its points.
Where it falls short
—
What hypotheses it suggests
Under the tested assumptions, a hypothetical capacity of 30 m³/s is insufficient to prevent flow toward Quebrada Honda. This is not an evaluation of the actual structure.
Status
Lower reference for the range explored in these scenarios: ECI 69/100.
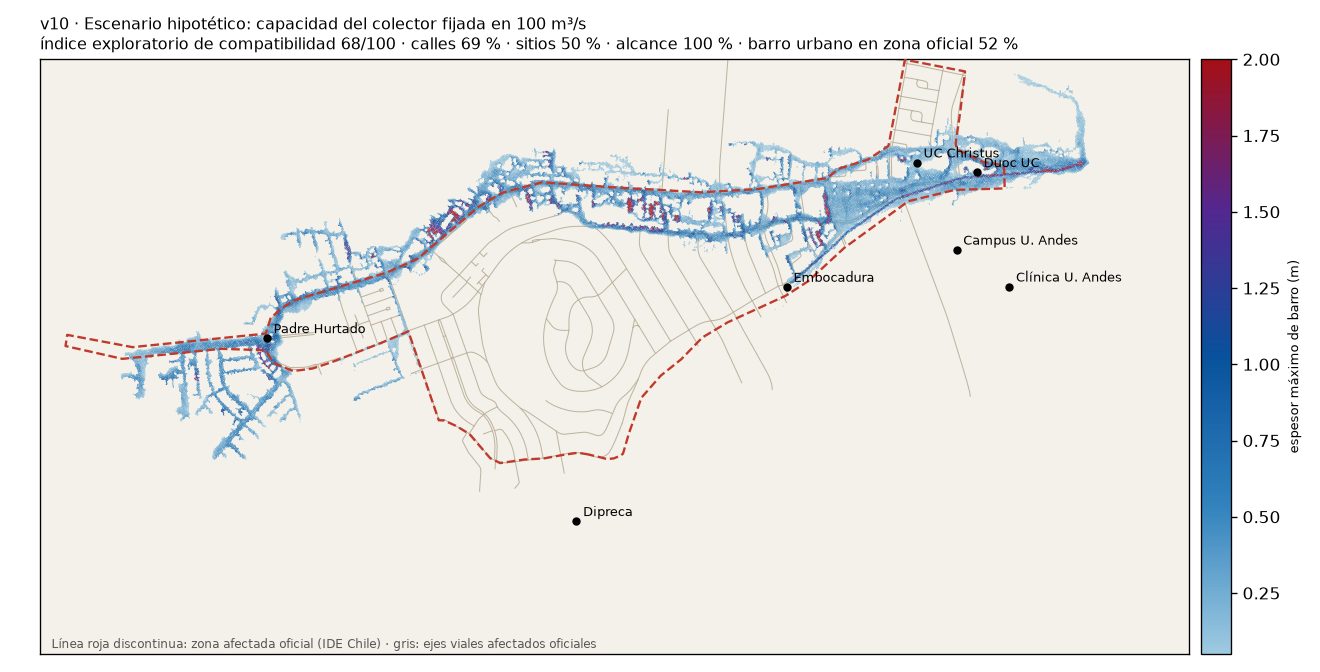
v10 · Hypothetical scenario: culvert capacity set at 100 m³/s
Index 68/100Streets 69Facilities 50Reach 100Mud in official area 52
What it tests
Hypothetical high-capacity scenario with capture across the entire channel cross-section.
What it shows
Calculated: the modeled culvert removes 94 thousand m³ with a peak of ~64 m³/s, and Quebrada Honda remains dry. At 200 m³/s the result is the same, because the calculated incoming discharge does not exceed ~65 m³/s.
Where it falls short
The scenario does not reproduce reported flooding on Quebrada Honda; this discrepancy does not establish how the actual culvert functioned.
What hypotheses it suggests
Under the assumptions tested, the hypothetical capacity that would prevent overflow is around 65 m³/s with full capture. A 12 m capture radius allowed flow to pass beside the sink: this was a representation artifact, now corrected.
Status
Upper reference for the range explored in these scenarios: ECI 68/100.
Mud type
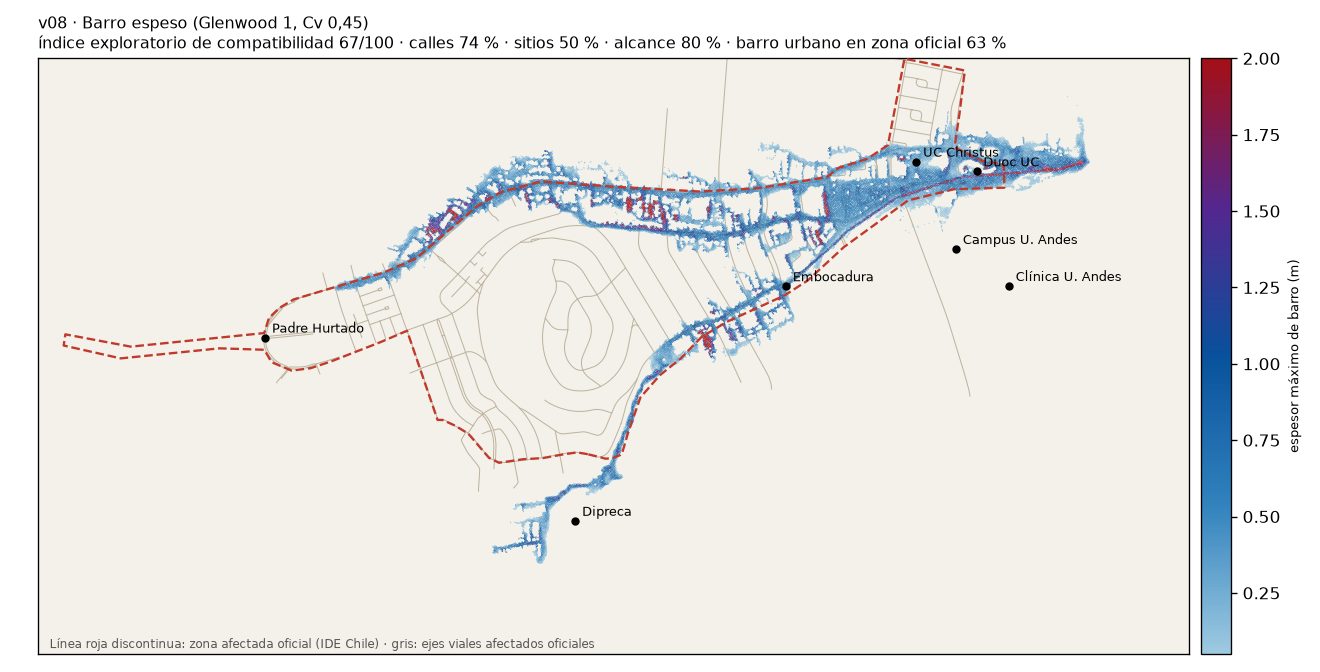
v08 · Thick mud (Glenwood 1, Cv 0.45)
Index 67/100Streets 74Facilities 50Reach 80Mud in official area 63
What it tests
A more concentrated and viscous mud (1,742 kg/m³, yield stress 29 Pa).
What it shows
Calculated: the front stops 396 m from Padre Hurtado.
Where it falls short
It does not meet the reach criterion.
What hypotheses it suggests
An intermediate material (Cv 0.43, v25) does not reduce mud outside the official area; across the full Cv range from 0.24 to 0.48 (concentration quadrature), the index remains between 71 and 73.
Status
Thicker-mixture variant: ECI 67/100.
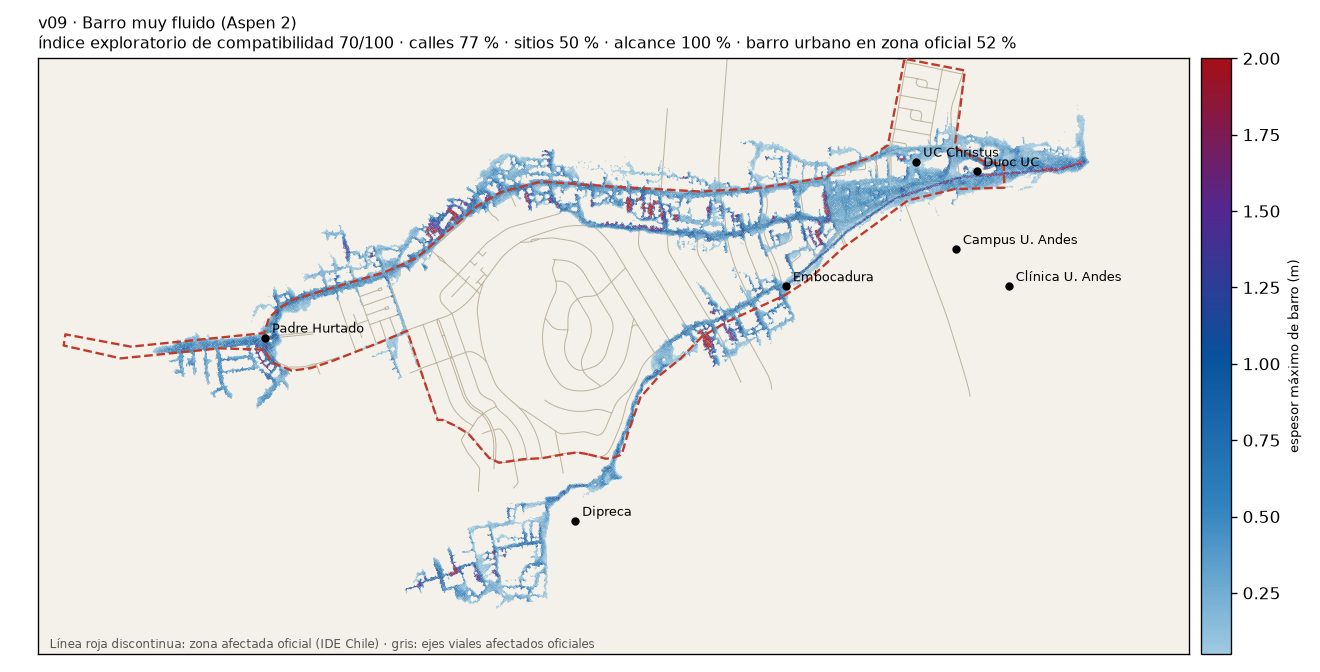
v09 · Very fluid mud (Aspen 2)
Index 70/100Streets 77Facilities 50Reach 100Mud in official area 52
What it tests
A more fluid mud than the reference material.
What it shows
Calculated: a result similar to the reference (ECI 70/100), with slightly more mud inside the official area.
Where it falls short
It does not reach the southern sector (without southern branches or rainfall).
What hypotheses it suggests
The ECI varies little among the materials tested; that variation alone does not summarize changes in reach, depth, or velocity.
Status
Sensitivity of the index to material: low. ECI 70/100.
Previous terrain (first model generation)
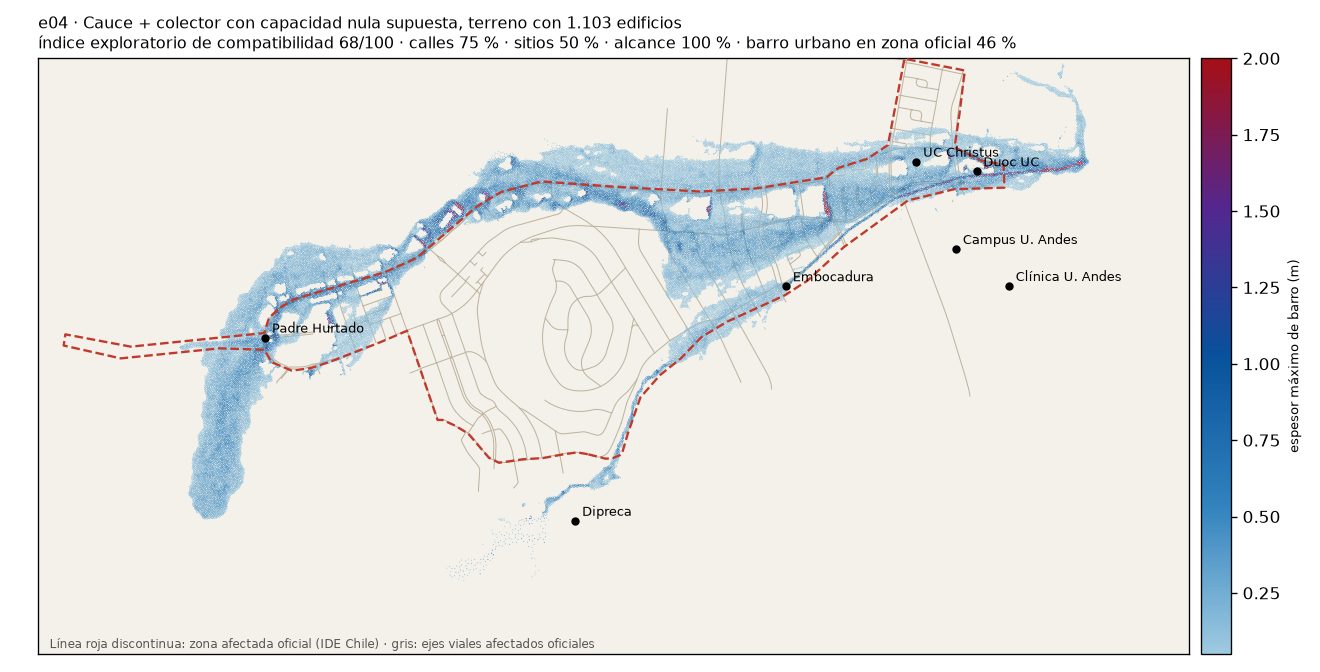
e04 · Channel + culvert capacity assumed to be zero, terrain with 1,103 buildings
Index 68/100Streets 75Facilities 50Reach 100Mud in official area 46
What it tests
The configuration selected in the first model generation (9 October), with only 1,103 buildings represented and the press-based perimeter criterion.
What it shows
Calculated: flow spreads more widely (93 ha inside the official area) in thinner layers and reaches Padre Hurtado.
Where it falls short
It calculates only 0.3 m near UC Christus (the source consulted reported about 1 m).
What hypotheses it suggests
Representing all buildings changed the results; representation as impermeable blocks could intensify channeling compared with a representation allowing storage in buildings (v26).
Status
Superseded by simulations with the full city (all 42,018 buildings): ECI 68/100.
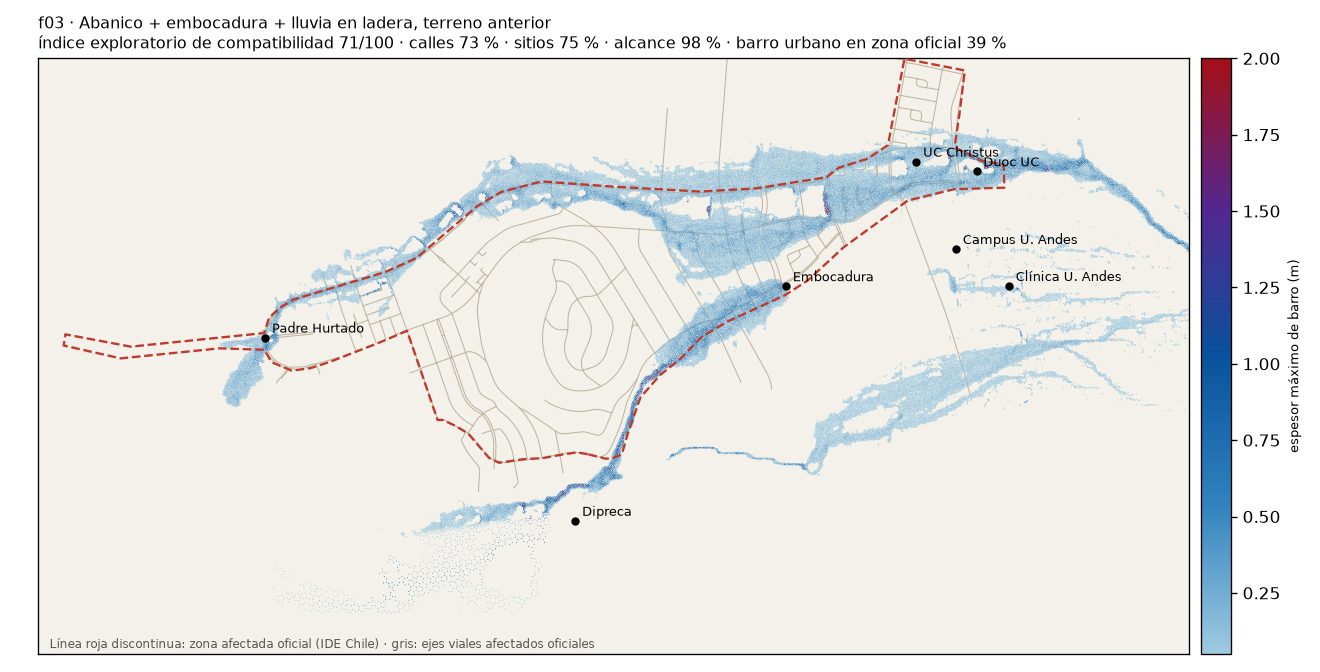
Index 71/100Streets 73Facilities 75Reach 98Mud in official area 39
What it tests
The first simulation with hillside rainfall, using the previous terrain.
What it shows
Calculated: it was the first to produce flow beside Clínica U. de los Andes and on La Plaza Sur.
Where it falls short
Low thickness near UC Christus and extension outside the official area.
What hypotheses it suggests
It led to the hypothesis selected for the held-out test (main channel + southern branches + rainfall, z02).
Status
ECI 71/100.
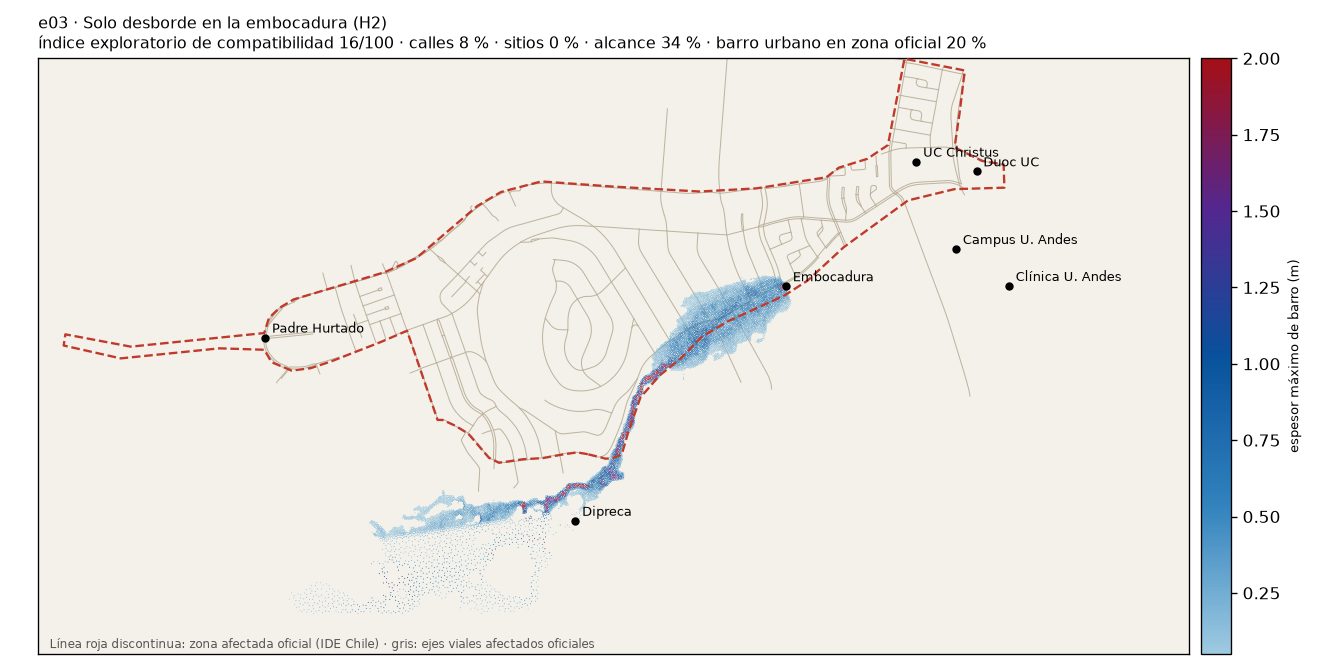
e03 · Overflow at the culvert inlet only (H2)
Index 16/100Streets 8Facilities 0Reach 34Mud in official area 20
What it tests
That all mud emerged from channel overflow at Francisco Bulnes Correa.
What it shows
Calculated: it wets Quebrada Honda, but none of the alluvial fan.
Where it falls short
It does not reproduce General Blanche, Camino El Alba, Duoc UC, or UC Christus.
What hypotheses it suggests
The sources consulted reported overflow at Bulnes Correa. Simulation e03 alone does not reproduce the full set of observations.
Status
It does not by itself reproduce the full set of observations under the assumptions and terrain of e03: ECI 16/100.
11 October round: what was tested and what resulted
Denser mud (v25, Cv 0.43): it does not reduce the extent outside the official area (fraction of mud inside the area: 0.346, versus 0.344 in z02).
Greater roughness in gardens and wooded areas (v27): this is the only test that reduces it somewhat (0.388); the index is 73/100.
Without double counting rainfall (v28): the indicators do not change, and impacts beside Clínica U. de los Andes persist (0.15 m).
More fluid mud on the lower hillside of the campus (v29): index of 72/100 when the campus point is excluded (78 without excluding it); repeated with a fine time step (z29), the campus remains wet and the verified index rises to 78/100.
Campus microsimulations (mesh 4 times finer): with overflows of 20 and 40 m³/s in the upper part of Álvaro del Portillo and muds of Cv 0.25 to 0.40, flow descends along the avenue and does not reach the Biblioteca. The tested overflow point lies outside the local Biblioteca catchment, about 220 m away. By contrast, rainfall of 35 mm/h for one hour over the campus hillsides, with a fluid behaving as a liquid (mr27), leaves up to 0.43 m beside the Biblioteca: this is the first configuration to do so and points to local runoff, not overflow from the avenue. It depends on the assumed intensity (Río Molina recorded 42.8 mm that day) and the 30 m terrain. The 12 October trials identified the route through La Plaza Sur and the clearing (see below).
Sensitivity detected: with the normal time step, the campus control point exceeds the 5 cm threshold (0.06–0.15 m); with a fine step it is 0.01 m. For this reason, the indices of 78–79 for v25 to v29 are replaced by their values without that point (72–73), following a rule recorded before selection.
Test using held-out observations: unfavorable result
Before examining results, 49 affected facilities from the official IDE Chile layer were held out and never used for fitting, and the criterion was set: the selected hypothesis had to produce mud within 15 m of at least 70 % of them and outperform two references. The selected hypothesis (z02) reaches 19 of 49 (39 %), the same as the main-channel-only hypothesis (v01); the hypothesis of overflow only at the culvert inlet (e03) reaches none. The test yielded an unfavorable result and is reported as such, without adjusting the model to pass it.
Interpretation: in addition to extending outside the official area, the reconstruction leaves substantial parts of it without mud (it wets about 20 % of its area and 32 % of its affected properties). The test does not refute the origin hypotheses, but shows that the current model does not adequately reproduce the spatial distribution of officially reported impacts. Some of the points not reached are service facilities whose impacts may have had other causes, a subsequent interpretation that does not change the result. Details in the protocol.
Trials after the test (12 and 13 October)
These experiments finished after the test using held-out observations. They are for fitting: they do not change its result, and a new selection will require new held-out observations.
Porous houses (v26, verified with a fine time step in z26): allowing mud to enter the lots increases urban mud inside the official area from 34 % to 54 %, wets 40 % of the affected properties, and meets all four criteria. Verified index: 76/100. Halving the resistance (v30) makes almost no difference. Trade-off: the depth at the UC Christus emergency department falls to 0.30 m (reported: about 1 m).
More liquid flow on the lower hillside (z29, fine time step): the campus is consistently wet. Verified index: 78/100.
Mud concentration (5 simulations, Gaussian quadrature): expected area of 169 ha (144–192 ha depending on concentration); thicknesses change very little (±7 %). The index remains between 71 and 73.
Campus and La Plaza Sur (microsimulations using a Meganoticias video and Google Earth and Street View data): overflow from Álvaro del Portillo does not reach the courtyard in the video; turbid water descending from the hill along a dirt road and along La Plaza Sur, with its carriageways at different elevations, enters through a clearing and fills it to 17–30 cm with 35 mm/h, within the range seen in the video; La Plaza Sur is wet along 81–87 % of its length at that intensity.
Integrated hypothesis (v32): porous houses, turbid water on the lower hillside, and the campus features. Index of 82/100 verified with a fine time step (z32), four out of four criteria, 0.61 m on campus, and 46 % of La Plaza Sur wet. A first attempt (v31) was discarded because of a configuration error.
With the measured rainfall (v33, 8 mm/h for 4 h, as recorded by CR2): the index falls to 79/100 and the share within the official area to 41 %; the campus remains wet (0.48 m), but the signal on La Plaza Sur and in the courtyard weakens. Part of the score of 82 depended on the assumed intense rainfall (35 mm/h for one hour).
Rainfall intensity on campus (microsimulations at 15, 25, and 35 mm/h): the La Plaza Sur → clearing → courtyard mechanism appears in all three cases; the courtyard reaches 12–17 cm and La Plaza Sur is wet along 41–87 % of its length. It does not depend on inflow from the short southern ravines or on excluding the contributing catchments.
Measured rainfall with its temporal pattern (p34): hyetograph from the Río Molina station (DGA), digitized from CR2 figure 3: 31.8 mm in 8 intervals of 30 minutes, with a maximum of 10.9 mm between 17:30 and 18:00. Index 81/100, between constant rainfall (79) and the assumed intense rainfall (82): the pulse concentrates the water and wets less area outside the official area. The corrected re-run (p34b, residual 0.00 %) confirms the result.
Porosity only in houses of 250 m² or less (d39): UC Christus remains at 0.31 m. The drop is due to mud stored by houses upstream, not building size. Rejected as a solution.
Without fire (f35 and f38es): with the volume given by the balance without fire (187 thousand m³), the mud wets 13–19 % less area, reaches fewer streets (0.70–0.73 versus 0.77), and leaves 0.19–0.23 m at UC Christus, versus 0.30 m. The index does not fall (80–82), because it rewards the fraction of mud within the official area: with these metrics, the urban model does not support a claim that the additional volume from the fire was necessary to reproduce the observations.
Log jam (arc and art): the main ravine was carved along the line of trees, with and without a 3 m accumulation at its end. The log jam does not divert flow southward: the Álvaro del Portillo and campus sector has the same 20.2 ha wetted in both cases. It retains and distributes mud near the alluvial fan, and the mud reaches less far west. Index 78 versus 79 (comparison between runs in the same batch). It does not explain the southern sector.
Bike park (mrbc and mrbt, microsimulations): with and without the main trail carved, the results on the road, La Plaza Sur, the clearing, and the courtyard are practically identical. Including the bike park and upper hillside area in the rainfall does add water (La Plaza Sur increases from 69 to 78 % wetted with 25 mm/h). Its possible sediment contribution cannot be evaluated with this model, which does not simulate erosion.
In progress
Repeating runs without the numerical artifact for measured rainfall and no fire (p34, f35, and f38), with a maximum time step of 0.5 s.
Independent study based exclusively on public data, with no official status; it does not evaluate real structures or attribute responsibility. Preliminary results requiring independent scientific validation.